Less driving is possible
Residents of several states and cities have driven fewer miles on average in recent years than they did two decades ago. This decline suggests that Americans’ high levels of driving are not inevitable.
For many decades after the introduction of the automobile, Americans drove more miles every year. The increase in driving was facilitated by a transportation system that made it easy to drive more, resulting in increased air and climate pollution and rampant sprawl, while giving Americans little choice but to spend their limited household incomes on cars.
However, residents in several states and cities have broken with this decades-long trend, and have driven fewer miles on average in recent years. A mix of reasons may have caused driving to decline in these various locations. One factor is a growing population in compact neighborhoods where residents don’t need to drive as far. Another factor is demographic change, such as when more people retire and no longer have a daily commute. A third contributing factor may be investments in infrastructure that supports walking, biking or riding transit, allowing residents to drive less.
Whatever the cause, the decline in per-capita driving – especially in a few leading cities and states – suggests that Americans’ current levels of car travel are not inevitable. Travel habits can change, leaving us with less pollution, safer and more pleasant communities, and, often, more choices than before.
Miles driven per person
Driving is measured in terms of “vehicle miles traveled,” or VMT – the total number of miles driven in all kinds of cars, trucks, buses and other vehicles. To compare how much people in different states drive, it is more useful to look at VMT per capita, the number of miles driven by each person.
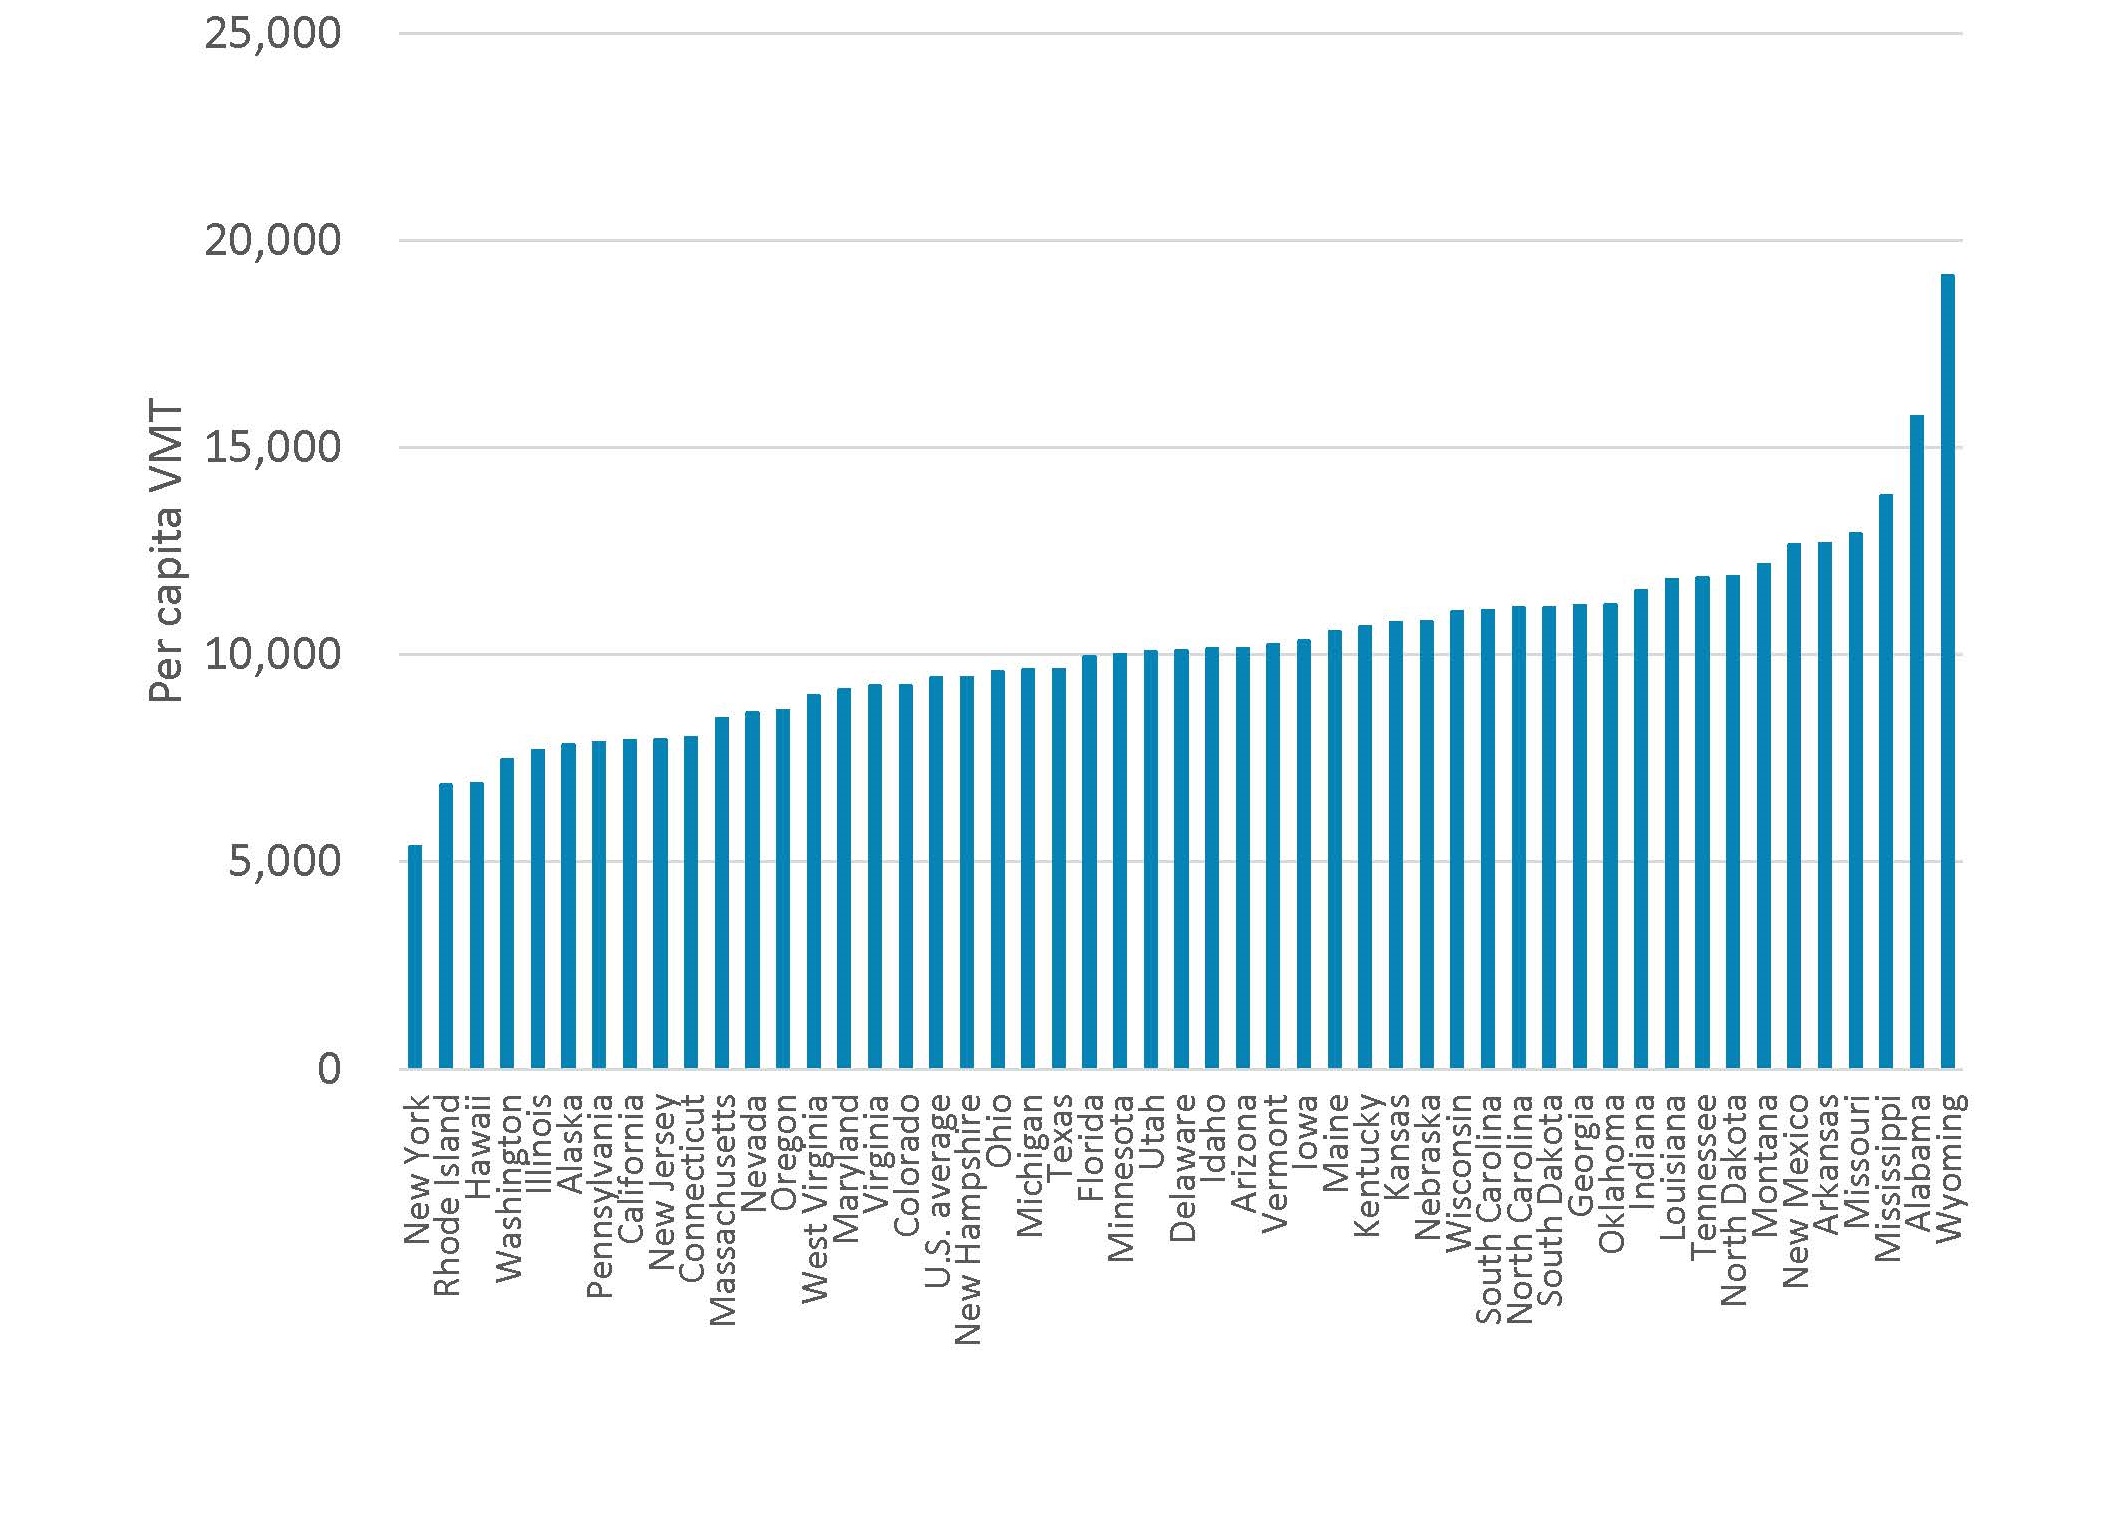
Per capita VMT varies tremendously from one state to another, influenced by development patterns, the availability of walking, biking and transit options, the age of the population, and other factors. Per capita VMT in 2021 was lowest in New York, Rhode Island, Hawaii and Washington state, ranging from 5,400 to 7,500 miles per person. The state with the most driving on a per capita basis in 2021 was Wyoming, with 19,150 miles per person, followed by Alabama, Mississippi and Missouri. Figure 1 shows per capita VMT for each state in 2021.* (In 2019, before the pandemic, per capita VMT in most states was slightly higher.)
Figure 1. VMT per capita by state, 2021

Change in miles driven per person
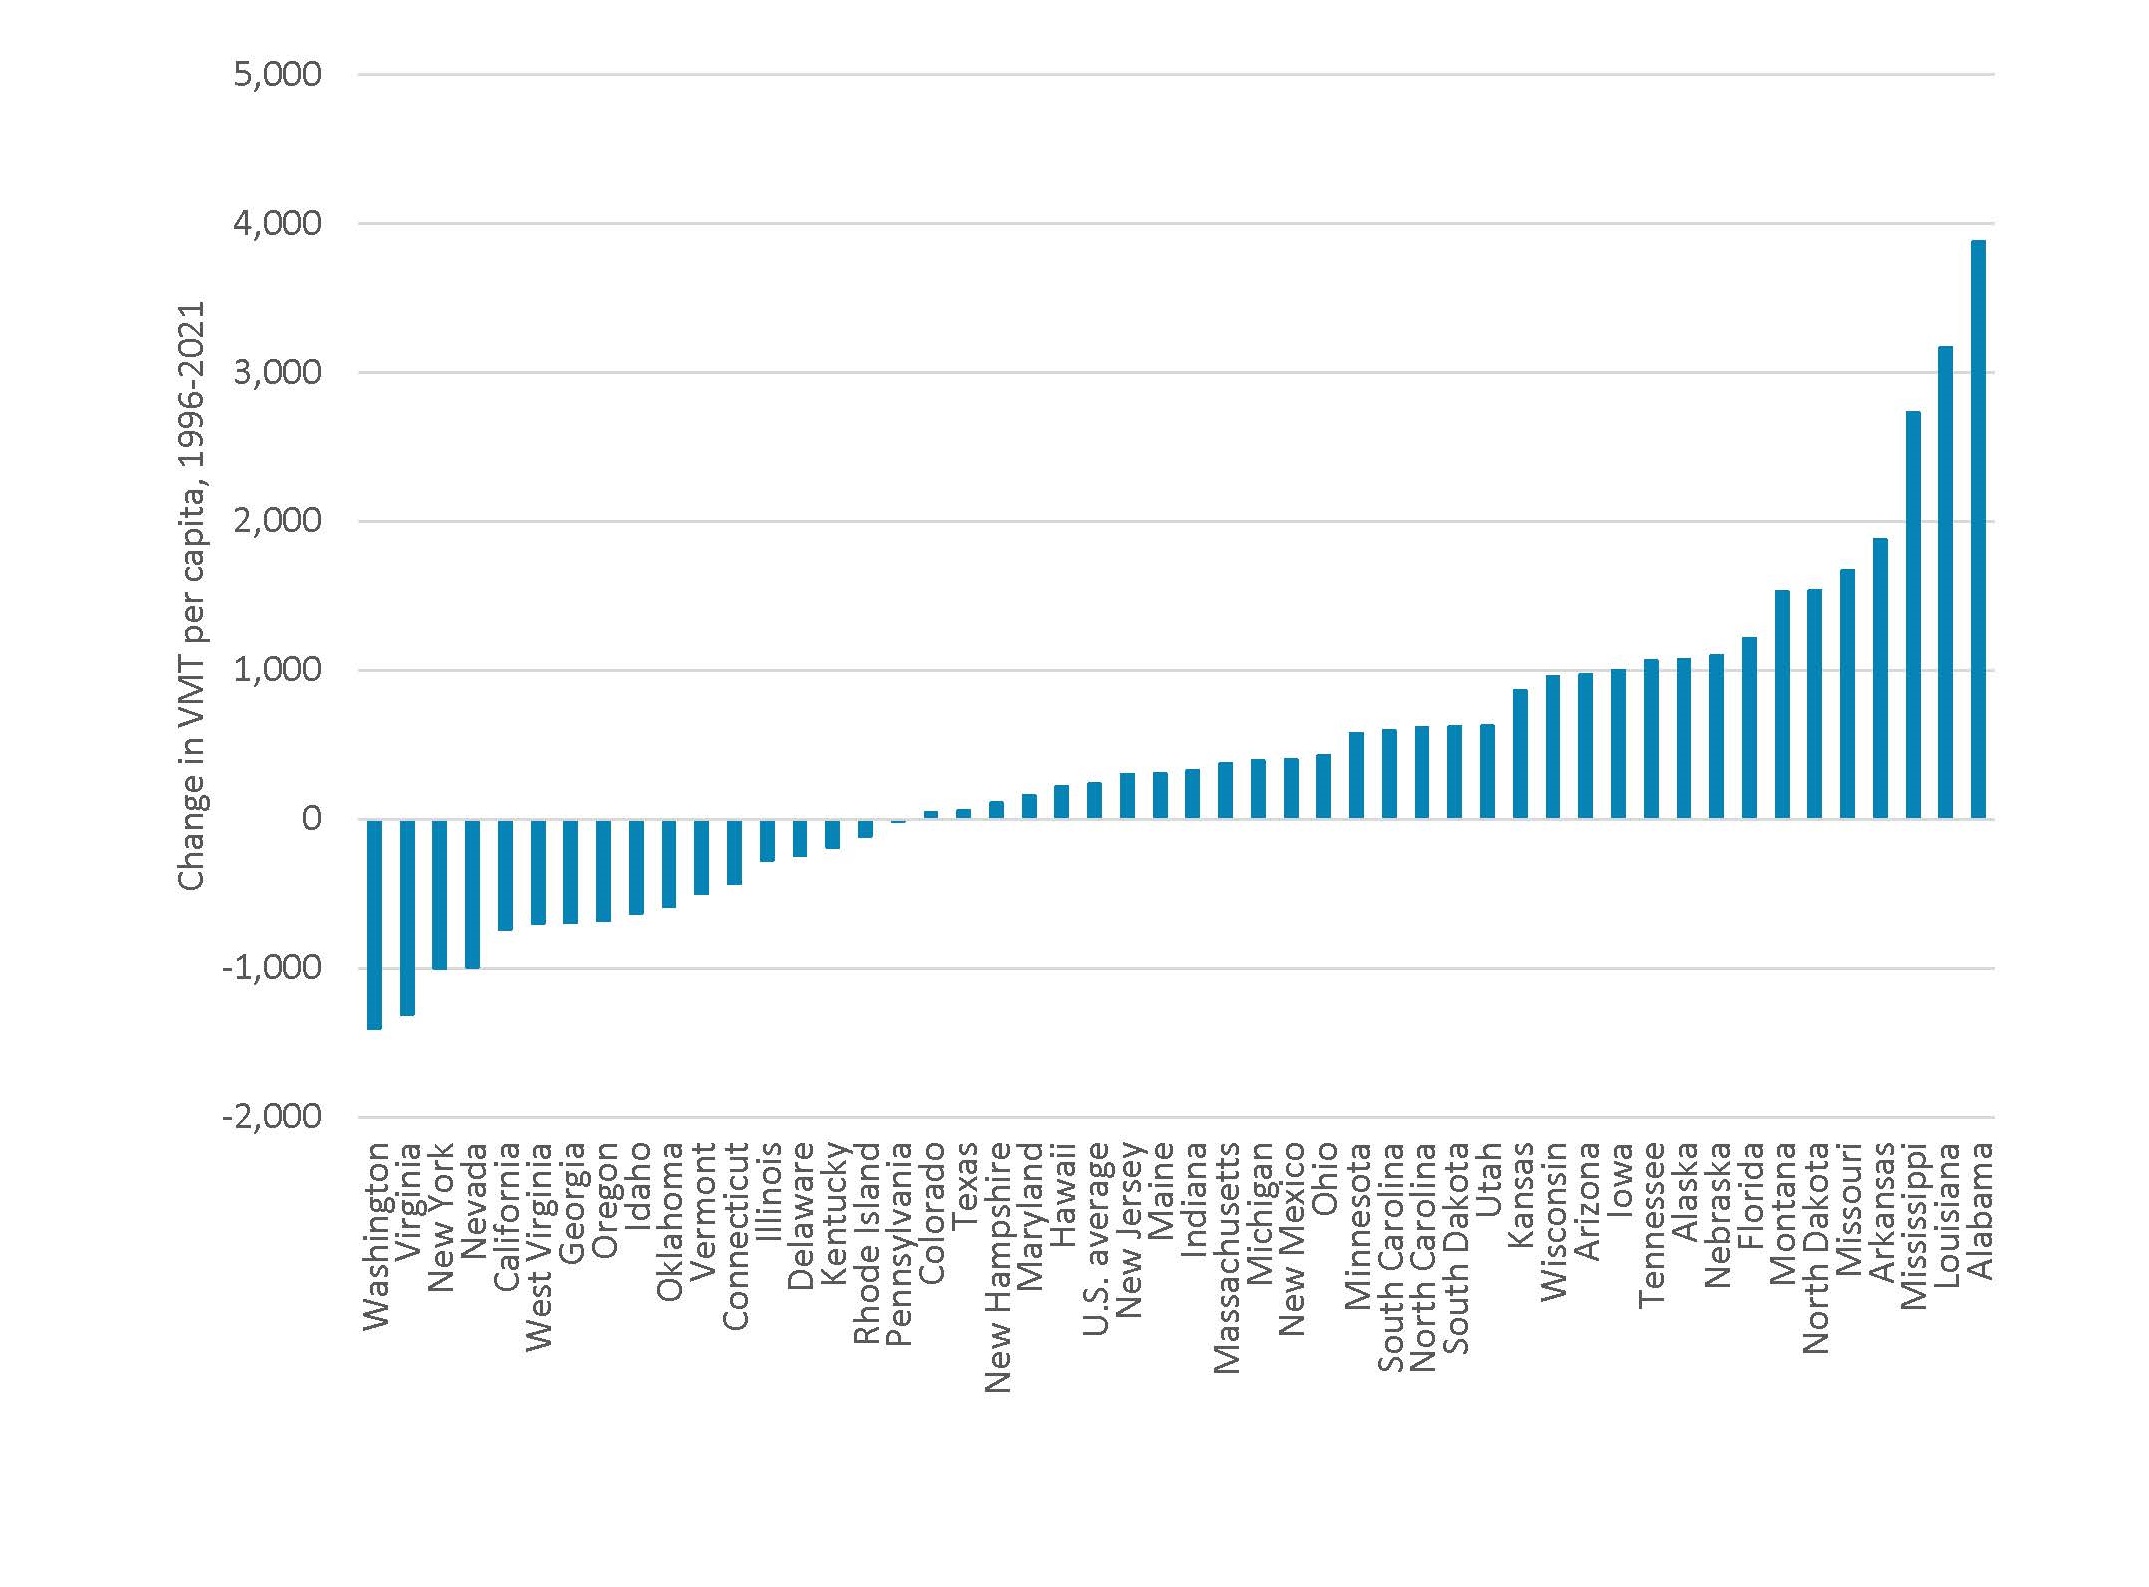
To understand how driving patterns have changed over time, we can look at change in VMT per capita over decades. Figure 2 reveals large variations between states. Over the 25-year period from 1996 to 2021, per capita VMT declined in 17 states and increased in the other 33. Before the pandemic, per capita VMT had declined in fewer states, with only eight states showing a decline from 1996 to 2019 and 42 showing an increase.
Figure 2. Change in per capita VMT by state, 1996-2021

Miles driven per person has fallen the most in Washington state
VMT per capita fell more in Washington state than in any other state over the past 25 years. Contributing factors in this decline may include the state’s decades-long program to reduce drive-alone trips to work, as well as reduced driving in Seattle, the state’s largest city.
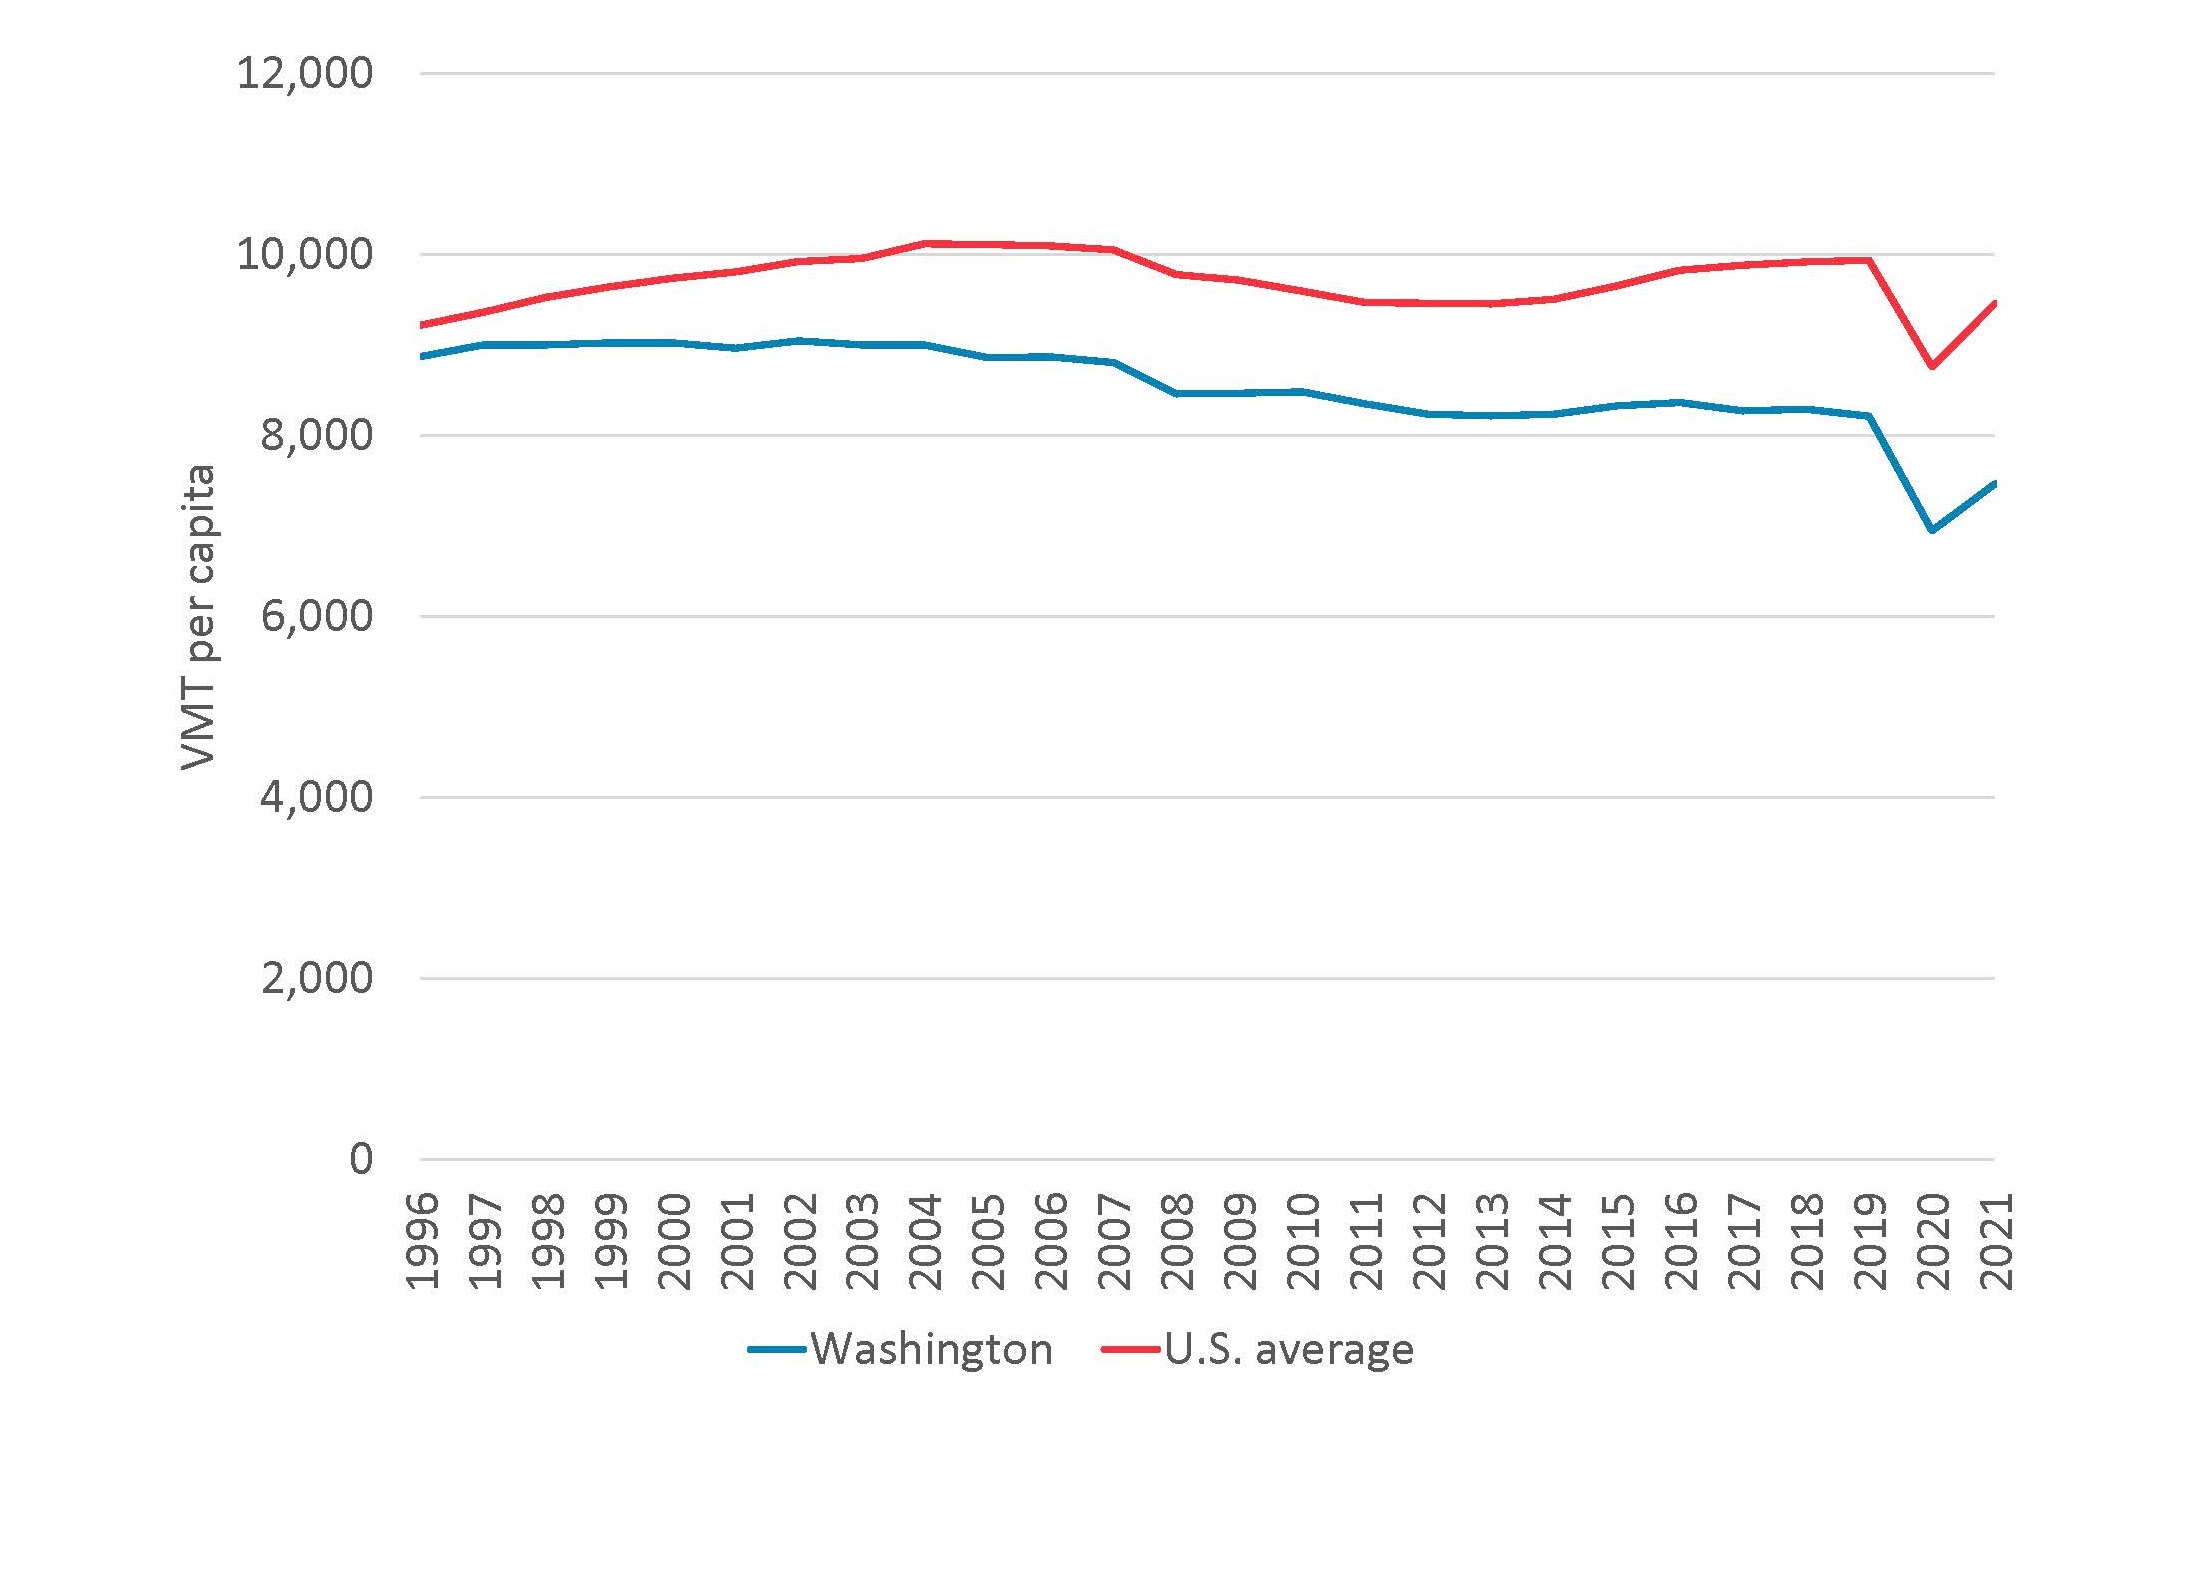
In 1996, Washington ranked 38th overall for per capita VMT, with residents driving an average of nearly 9,000 miles per year. By 2021, per capita VMT in Washington had dropped to 7,500 miles per year and the state was ranked 47th for per capita driving. In 2021, the average Washington resident drove 1,400 fewer miles annually compared to 1996. In contrast, the average American drove an additional 240 miles in 2021 compared to 1996. (See Figure 3.) In 2019, the year before the pandemic, the average Washington resident drove 700 fewer miles compared to 1996 while the average American drove 700 more miles compared to 1996.
Figure 3. Per capita VMT in Washington state decreased from 1996-2021

One reason that VMT has fallen more in Washington than in other states may be the result of Washington’s efforts to reduce the number of people who drive alone to work. Washington adopted a commute-trip reduction law in 1991 that requires worksites with 100 or more full-time employees who must start their work day between 6 and 9 a.m. to provide employees with tools and incentives to help make it easier for them to get to work without driving, or to work from home. The law has significantly reduced commute driving. Approximately half of the 600,000 employees who are covered by the Commute Trip Reduction Program drove alone to work in 2019/2020, versus 71% for other Washington employees. Nationally, 76% of employees drove to work alone.
Another reason for declining per capita VMT in Washington is that per capita VMT in Seattle, the largest city in the state, has declined.
Seattle’s per capita VMT has declined for more than a decade, dropping from approximately 7,400 miles per resident in 2005 to 6,150 miles in 2018. (Total VMT in that period increased, however, because the city’s population increased more rapidly than per capita VMT declined. Had these new residents not moved to Seattle, they may have lived in areas that required more driving.)
Few people who work in Seattle drive to work alone. A survey conducted in Fall 2022 of workers across Seattle found that just 21% drove to work alone, down from 26% in 2019 and 35% in 2009. Walking and transit use also declined as working from home increased dramatically due to the pandemic. However, commuting trips represent only a fraction of the total trips that Seattle residents take, and most non-work trips still involve driving alone. More than 75% of grocery store, health care and school pick-up and drop-off trips are completed by driving alone.
Several investments have helped Seattle achieve relatively low rates of car-based commuting and provide residents with more options for non-work trips.
- Seattle-area voters approved funding in 1996 to create a regional transit system, and additional funding in 2008 to add 36 miles of light rail. Another voter-approved funding measure will enable the system to expand more in the coming years.
- In 2015, Seattle voters approved funding to improve the frequency and reach of bus service. When the ballot measure passed, only 25% of Seattle households lived within a 10-minute walk of bus service that operated on a frequency of 10 minutes or less. By 2019, bus service improvements meant that 70% of households were within a 10-minute walk of a route that had buses at least six times an hour. (More recently, a shortage of drivers, mechanics and equipment has forced some service reductions.)
- That 2015 ballot measure also provided funding to make walking and biking safer and more comfortable, such as with protected bike lanes and more signalized crosswalks.
Miles driven per person has fallen in select other cities
Seattle is not the only city where development patterns and transportation investments have helped to reduce per capita VMT. The Portland-Vancouver region, Washington, D.C., and Minneapolis have all experienced sustained declines in per capita VMT.
In Minneapolis, from 2007 to 2017, average daily miles driven fell approximately four miles per person, declining from nearly 20 miles per person per day in 2007 to just under 16 miles per person per day in 2017. Because 35,000 more people lived in the city, total miles traveled remained the same.
Residents drove to work less often, replacing some commute trips with walking or cycling. Driving accounted for a slightly smaller share of commute trips over 11 years, while the share of commute trips completed by walking or biking increased. By 2017, walking and biking together accounted for 12% of commute trips while driving accounted for 70%.
Walking and biking also increased for other kinds of trips. At key intersections and points within the city’s walking and biking network, the city counted 21% more people walking and 53% more people biking in 2017 compared to 2007.
Minneapolis has made a number of investments and policy changes that have helped reduce driving by giving residents more travel choices and by supporting development that puts more homes, jobs and shops within walking or biking distance.
- The city has invested in a network of routes and paths to make biking easier and safer. Starting with 80 miles of bikeways in 1997, Minneapolis had added 45 miles by 2007 and another 119 miles by 2017. Subsequently, the largest increase in biking has occurred in portions of the network where people walking and biking have greater distance or protection from people who are driving.
- The city has also expanded transit options, opening its first light rail line in 2004 and adding additional rail and bus rapid transit through the 2010s. This helped increase overall transit ridership.
- Apartments and townhomes, rather than single-family homes, accounted for a large share of development from 2010 to 2016. This more compact style of development can shorten the distance between destinations, making leaving the car at home easier.
The investments reflect goals Minneapolis has adopted to reduce climate pollution; enable people in every neighborhood to meet their daily needs via walking, biking and public transit; and increase bicycling’s share of commute work trips, among other goals.
The success of Minneapolis, Seattle and Washington state in reducing per capita VMT demonstrates that ever-increasing driving does not have to be our national fate. Policy decisions and changing economic and demographic realities can cause per capita VMT to decline, and transportation planning and investments should reflect that.
Change is possible, and a future of less pollution, better quality of life and more transportation choices can be ours.
* We downloaded 1981-2017 per capita VMT data provided by Jeff Davis of the Eno Center for Transportation. We calculated per capita VMT for 2018-2021 using VMT data from the Federal Highway Administration’s Highway Statistics 2021 Table VM-202 and state population estimates from the Census Bureau. 2018-2019 population estimates came from Table NST-EST2019-01 and 2020-2021 population estimates came from Table NST-EST2022-POP. All information was downloaded on 4 May 2023.
Topics
Authors
Elizabeth Ridlington
Associate Director and Senior Policy Analyst, Frontier Group
Elizabeth Ridlington is associate director and senior policy analyst with Frontier Group. She focuses primarily on global warming, toxics, health care and clean vehicles, and has written dozens of reports on these and other subjects. Elizabeth graduated with honors from Harvard with a degree in government. She joined Frontier Group in 2002. She lives in Northern California with her son.
Find Out More

Green schools guide

Why privacy matters – even if you’ve got nothing to hide

How to set New Year’s resolutions that help the environment


