References for Fix It First Fact Sheet
Fix-it-first factsheet sources
America’s transportation infrastructure needs repair
- Roads: United States Department of Transportation, quoted in “Fact Sheet: The American Jobs Plan,” The White House, March 31 2021.
- Bridges: Federal Highway Administration, National Bridge Inventory, “Performance History.”
- Percentage of roads in “poor” condition: Transportation for America, Repair Priorities 2019, p.21.
- Percentage increase in 37 states: Transportation for America, Repair Priorities 2019, p.19.
- Total percentage nationwide increase: Transportation for America, Repair Priorities 2019, p.20.
- Vehicle-miles percentage increase: American Society of Civil Engineers, 2021 Infrastructure Report Card, p.108.
Highway expansion consumes money we need for repairs
- Road and bridge repair backlog: $560.4 billion. U.S. Department of Transportation, Federal Highway Administration, Status of the Nation’s Highways, Bridges, and Transit Conditions and Performance Report, 23rd Edition, “Chapter 7 – Capital Investment Scenarios” Exhibit 7-9.
- Funding for road construction and expansion vs repair and rehabilitation: Transportation for America, Repair Priorities 2019. Between 2009 and 2014, road repair accounted for 30% of states’ total capital spending on highways, and road expansion 29%.
- 2014 highway expansion spending: U.S. Department of Transportation, Status of the Nation’s Highways, Bridges and Transit: Conditions and Performance Report 23rd Edition, Exhibit 2-14, cited in Gideon Weissman et al., Highway Boondoggles 6, December 2020, p.5.
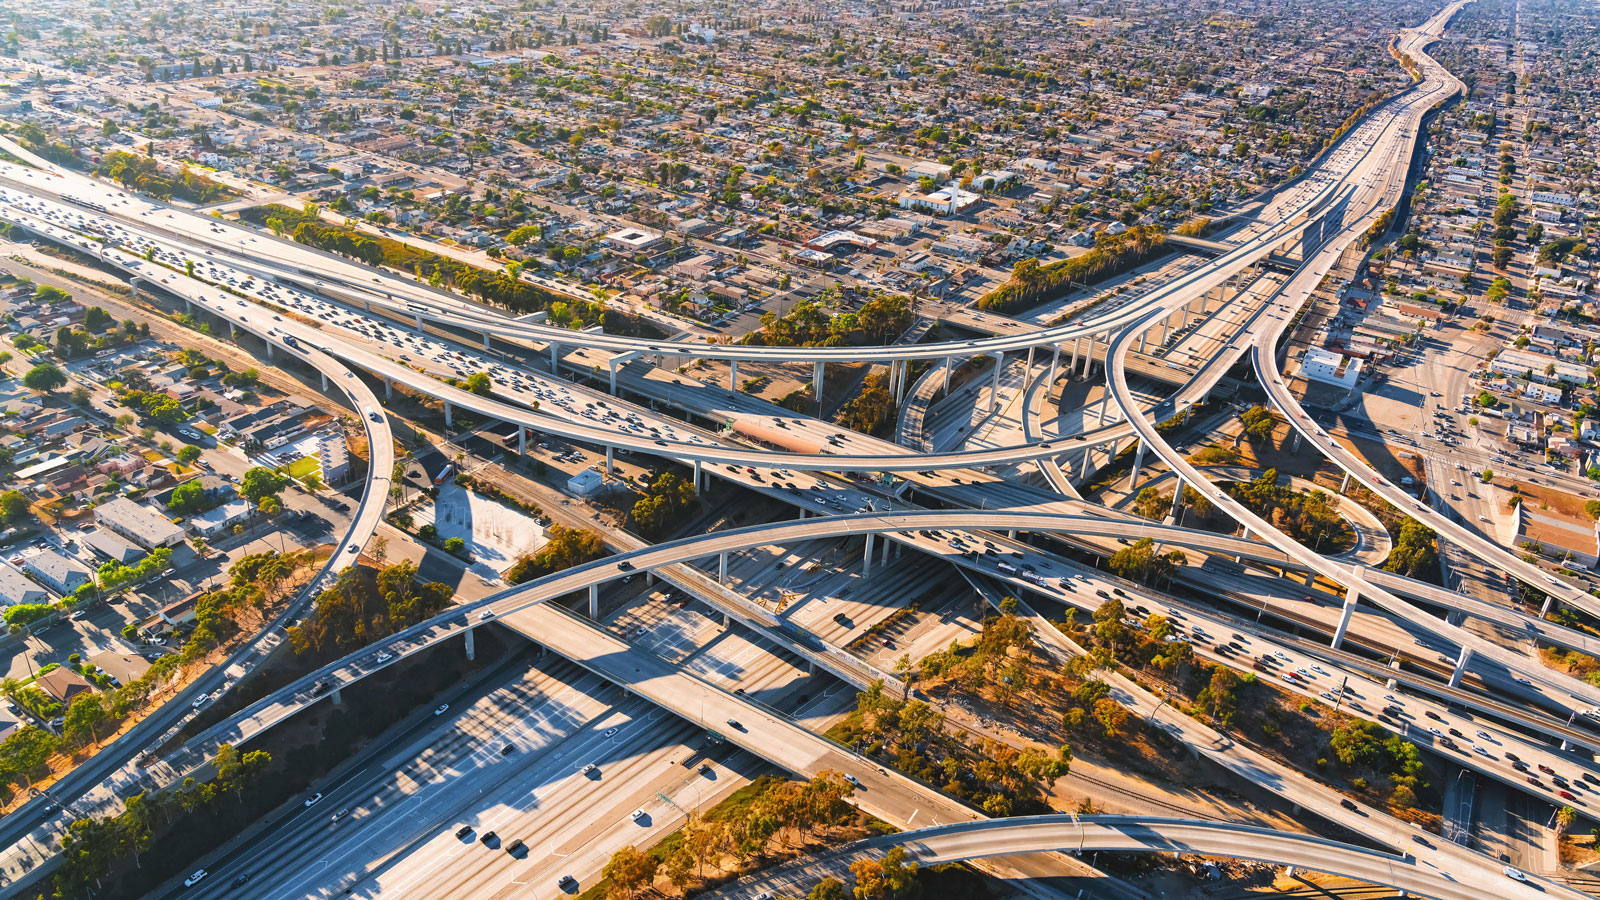
- Growth of U.S. public road network: 223,494 lane-miles. Transportation for America, Repair Priorities 2019 p.12. Area larger than Los Angeles: 5280 feet in a mile x 223,494 lane-miles = 1,180,048,320 ft of pavement. 1,180,048,320 x 12 ft lane width = 14,160,579,840 ft2 of pavement. 27,878,400 ft2 in 1 mi² = 507.9409 mi² of pavement. Los Angeles area: 503 mi².
- $24,000 per new lane-mile: Transportation for America, Repair Priorities 2019, p.11. Additional spending required: $5,363,856,000 ($24,000 x 223,494 lane-miles).
Americans want to fix it first
- Polling: Transportation for America, “Voters want and need more transportation options,” 17 March 2020.
- $231.4 billion. $169 billion per year to keep our good roads “good,” plus $62 billion per year on top of that to address the backlog of poor roads. 2015 expenditures: $105.4 billion. Transportation for America, Repair Priorities 2019, pp.9-10.
- $105 billion transit infrastructure repair backlog. “Fact Sheet: The American Jobs Plan,” The White House, March 31 2021.
Charts: Federal Highway Administration, Status of the Nation’s Highways, Bridges, and Transit Conditions and Performance Report, 23rd Edition, “Chapter 7 – Capital Investment Scenarios.”
Topics
Find Out More

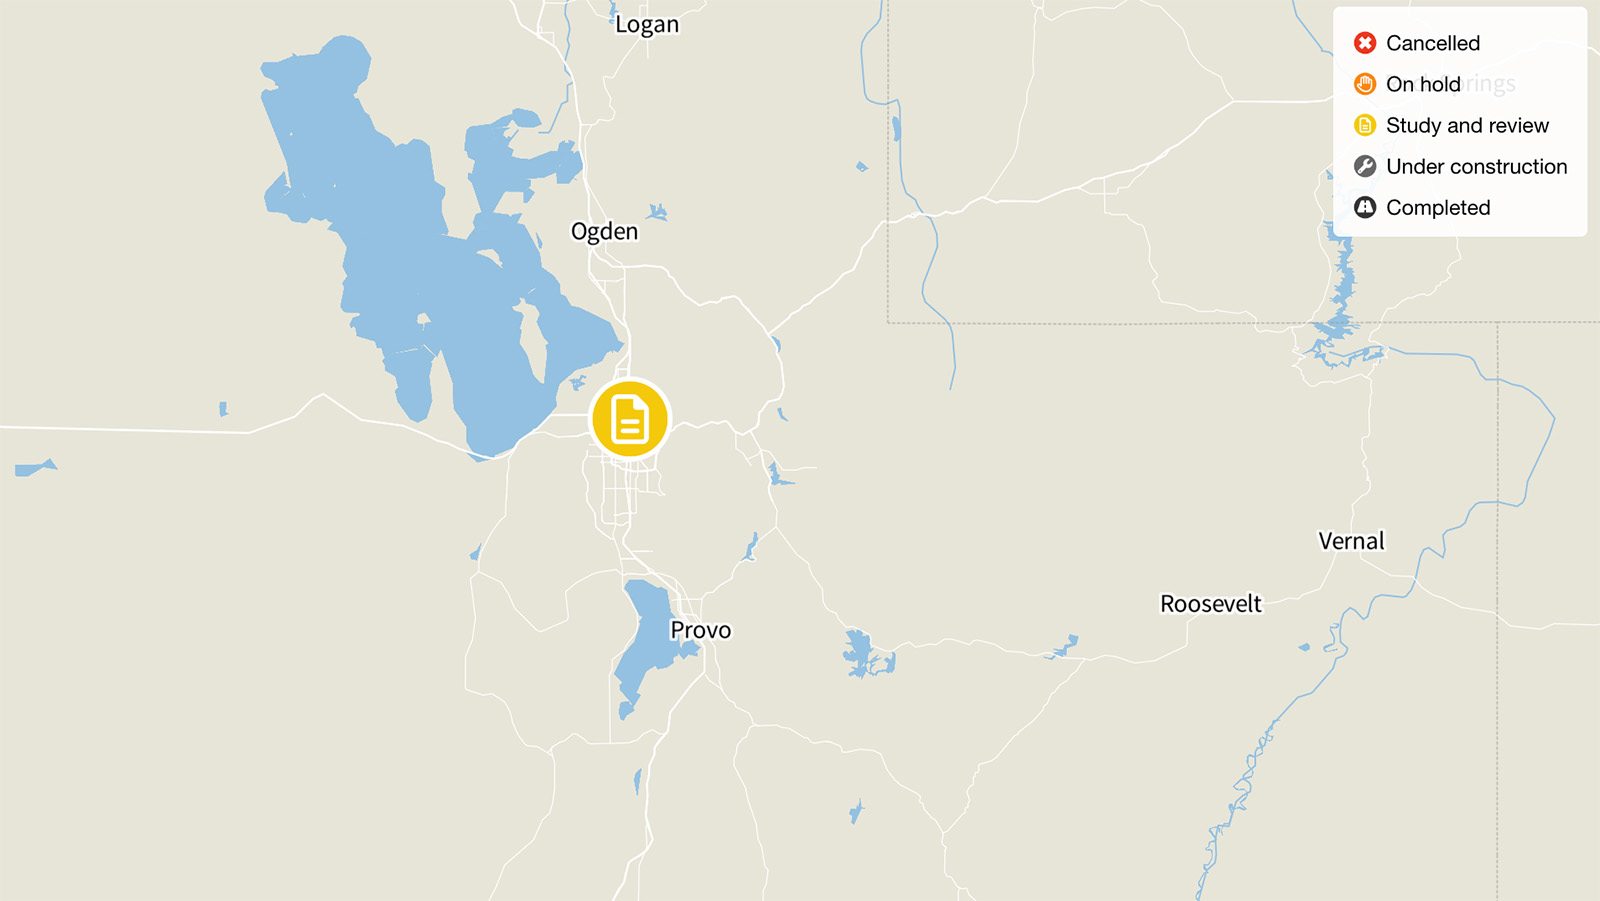
I-15 Expansion, Salt Lake City
The Brooklyn-Queens Expressway, New York
