Following the Money 2019
Boston -- Massachusetts received a “C” for making critical information about how governments are subsidizing business projects with taxpayer dollars readily available to the public online, according to a new report from MASSPIRG Education Fund and Frontier Group. Following the Money 2019, the organization’s tenth evaluation of online government spending transparency, gives 17 states a failing grade, while only four states received a grade of “B” or higher.
Downloads
Executive summary
Citizens’ ability to understand how their tax dollars are spent is fundamental to democracy. Budget and spending transparency holds government officials accountable for making smart decisions, checks corruption, and provides citizens an opportunity to affect how government dollars are spent.
State and local governments spend billions of dollars every year on economic development programs in the form of forgone tax revenue and direct cash grant payments to corporations in an effort to stoke investment and job creation in a particular city, state or industry.
A review of economic development subsidy reporting in all 50 states finds that a majority of states fail to meet minimum standards of online transparency, leaving residents, watchdogs and public officials in the dark about key public expenditures. States should shine light on economic development subsidies by requiring the online publication of key transparency reports and inclusion of economic development spending in the state’s online checkbook portal to meet the expectations of citizens seeking information in the 21st century.
Economic development subsidies – be they tax exemptions, credits, or direct cash grant payments – are a form of public spending, but are rarely held to the same transparency standards as other government expenditures.
Economic development subsidy reporting is so poor nationwide that no comprehensive account of the number or size of active incentive programs exists. However, a 2011 study by Kenneth Thomas estimated that local and state economic development programs spend more than $65 billion annually (over $70 billion in 2019 dollars.)
Table ES-1: Top 10 and Bottom 10 States in Providing Online Access to Economic Development Subsidy Data

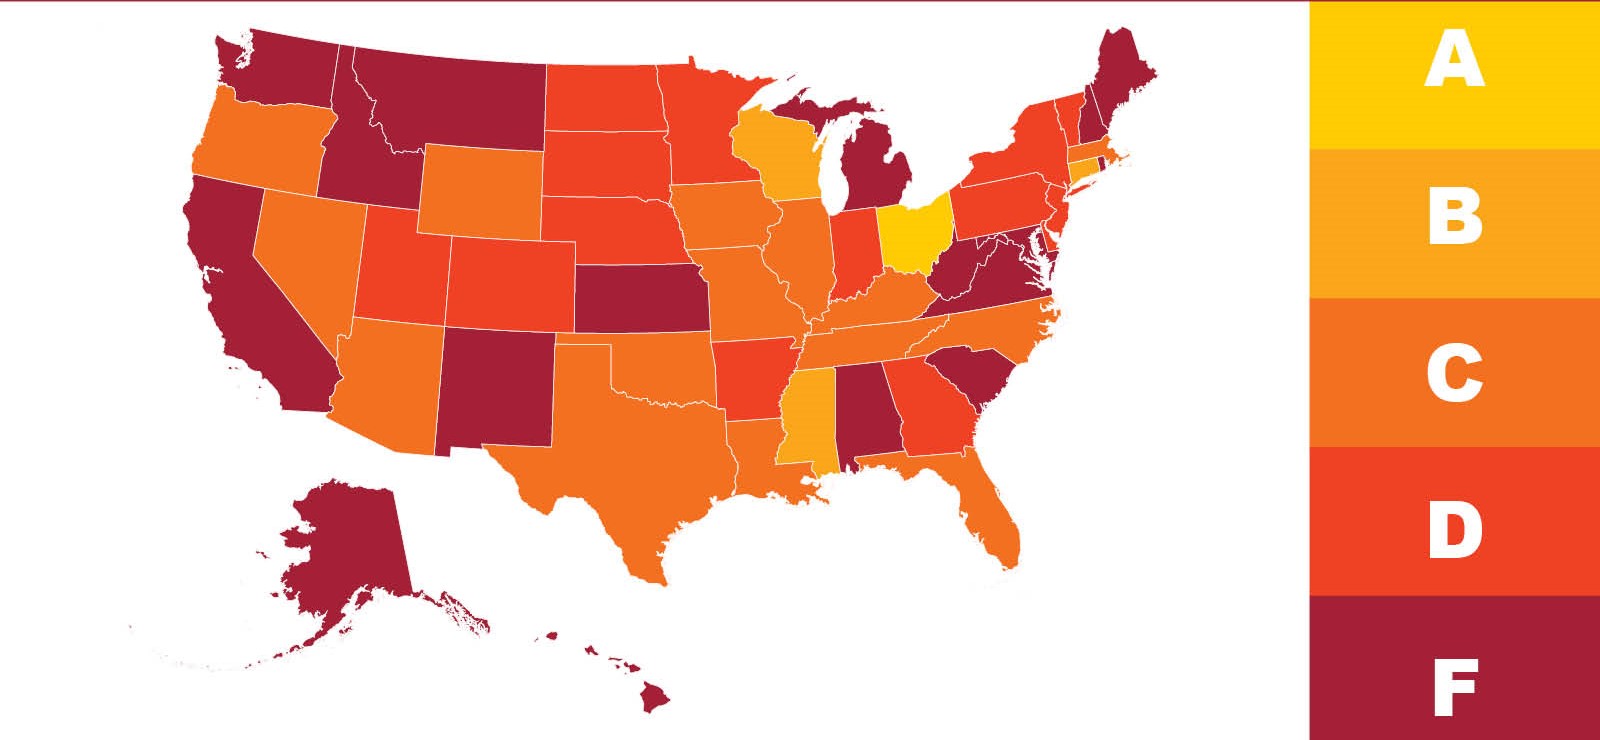
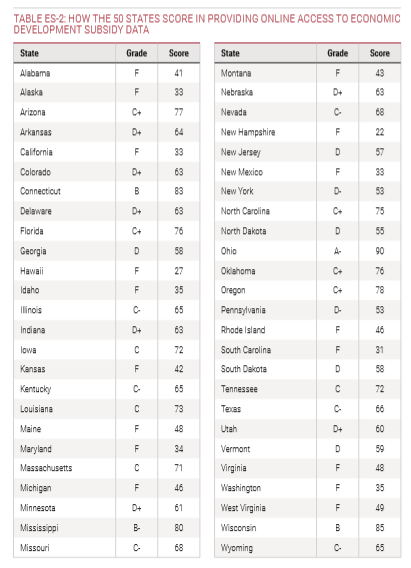
This analysis – U.S. PIRG Education Fund’s tenth evaluation of state online financial transparency – finds that states are failing to provide comprehensive, accessible and complete information online on economic development subsidies. Over a third of states (17) fail to meet even basic transparency standards when it comes to state-administered economic development subsidies. (See Figure ES-1 and Table ES-2).
● Leading States (“A” range): Ohio is the only state that currently provides citizens with an acceptable and consistent level of information about economic development subsidies. It has made an effort to provide economic development spending information across a number of formats including the state’s online checkbook portal and an annual report of grant programs. The grants report is required by law and includes actual job creation and benefit numbers for each active program, allowing citizens and decision-makers to tell how economic development projects performed relative to their stated goals.
● Advancing States (“B” range): Three states – Wisconsin, Connecticut and Mississippi – are “advancing” states in economic development subsidy transparency. All three states include itemized grant payments to companies in their online spending portals, a transparency measure both Mississippi and Connecticut require by state statute. Both Wisconsin and Connecticut incorporate their primary economic development agency’s grant payments directly into the state’s general expenditure checkbook and are two of only three states to publish an annual report detailing statewide economic development grant spending.
● Middling States (“C” range): Fifteen states are “Middling” in economic development transparency. All of these the states fulfill the most important modern transparency requirement by including payments made by the primary economic development agency in the state’s transparency checkbook. However, only seven provide both the projected and actual benefits of subsidy payments and only nine publish an annual tax expenditure report.
● Lagging States (“D” range): Economic development subsidy reporting in the 14 Lagging States fails to provide critical information to citizens in a readily accessible format. These states typically provide information in either an annual report or online portal, but not both. Minnesota, for instance, is among only five states nationwide to publish a statewide grants report, but fails to post grant payments in the state’s online checkbook.
● Failing States (“F” range): Over a third of states – 17 – fail to meet our basic standards of online spending transparency for economic development subsidies. Only 10 of these states publish some kind of annual grants report, while only two include grant payments made by the primary economic development agency in the state’s online checkbook.

The lack of transparency of economic development subsidies has real implications for citizens and decision-makers alike.
● Transparency can help citizens and decision-makers identify when programs are failing to meet their stated goals. For example, Virginia’s most recent statewide annual report found that only 26 percent of projects receiving subsidies from the state of Virginia met their job creation goals from 2010 to 2017.
● A 2018 Louisiana compliance audit found that the lack of transparency of economic development subsidies meant “the legislative committees charged with making decisions to revise or eliminate costly incentive programs continue to lack critical information necessary to make key decisions.”
● A report by the Maine State Legislature’s Office of Program Evaluation and Government Accountability concludes that the opacity of many subsidy programs impedes state policymakers from having “accurate and reliable information about these programs to make informed decisions” and that “Maine’s citizens and businesses also deserve as much transparency and accountability as possible around these programs.”
Economic development subsidies are a particularly shadowy category of public expenditures, making transparency about their spending even more important.
● Most states have multiple agencies that administer economic development programs. For example, Wisconsin’s annual statewide report includes 57 incentives overseen by nine agencies. Most states lack an agency that serves as a central repository for all economic development spending data in the state, making it harder for citizens and decision-makers to track down truly comprehensive spending information, like the total cost of a project receiving multiple subsidies.
● Many economic development agencies are quasi-public agencies or special districts that often operate without adhering to modern standards of government spending transparency. Others are entirely private, non-profit entities that are not required to follow even basic transparency measures, such as holding public meetings or releasing documents under the state’s public records law, even if the agency receives millions in state funding.
● The vast majority of agencies, even those that are a part of state government, shield information on economic development deals on the assumption that transparency is bad for a state’s competitiveness.
All states have opportunities to improve their transparency.
State governments should provide the public with as complete, accessible and understandable information on economic development spending as other typical state expenditures. Priority areas for improvement include:
● The online checkbook portals of 20 states fail to provide checkbook-level information on recipients of economic development subsidies administered by the state’s primary economic development agency. Including this information in states’ existing online spending portals – many of which have improved dramatically in recent years – would provide greater transparency and accountability.
● Only six states – Florida, Maine, Minnesota, Connecticut, Virginia and Wisconsin – publish a comprehensive, statewide report detailing economic development spending of all active programs. Only Virginia, Connecticut and Wisconsin, however, publish those reports on an annual basis. Maine’s and Minnesota’s reports are published every other year, and Florida’s accounts for all active programs on a three-year cycle. Publishing a report that details all economic development spending across every agency disbursing funds would provide a crucial tool for decision-makers and citizens to understand the full scope of economic development spending occurring in the state.
● Only seven states have a law that requires the annual, online publication of a report detailing grant payments for all active economic development programs. An additional 30 states have a law requiring the publication of a similar report by the state’s primary economic development agency. Requiring the publication of an annual report helps to shore up the continuity of the information provided regardless of changes within an agency or political leadership.
● Twenty-three states publish a tax expenditure report less frequently than every year. Annual reporting of tax expenditures ensures citizens and decision-makers have access to current information.
● Only 33 states publish the actual program or recipient-specific benefits of economic development subsidies, while just 25 provide the projected benefits. Only 18 states provide both projected and actual benefits, allowing watchdog groups, concerned citizens and decision-makers the ability to compare program outcomes with what was promised.
Confirmation of findings with state officials
Our researchers sent initial assessments and a list of questions to transparency website officials in all 50 states in order to ensure that the information presented in this report is accurate and up to date. States were encouraged to involve officials in other agencies as necessary. In some cases, states provided contact information for an official in the state’s economic development agency, and initial assessments were then sent to these individuals instead.
For all of the grades, state transparency officials were given the opportunity to verify information, clarify their online features, and discuss the benefits of transparency best practices in their states. Officials from 42 states provided feedback. For a list of the questions posed to state officials, please see Appendix C in the report.

Topics
Find Out More


How to get your stimulus payments when you file your tax return

Tips to file your tax return while avoiding fees, scams
